
Earlier this month, we shared with you the first step in the LEAD Quality Process Model, a system we use to ensure the best quality in all of our projects. We know how important quality is to you as well, so today we’re focusing on step two. To recap, LEAD stands for:
L: Listen
E: Evaluate
A: Answer
D: Deliver
Just four steps that, if done well, can save your project. Revisit our last blog to learn to Listen, then let’s break down how to Evaluate.
—
EVALUATE
- Gather data for requirements and/or measure the extent of the problem.
- Analyze the data and understand why the problem happens or what requirement is needed.
You’ve thoroughly communicated with and listened to your customer and know exactly what they’re looking for, which means you know any and all challenges of the project, and its requirements. Now you can evaluate all of these elements to start working.
For this step, we find visual plans to be extremely helpful. They’re effective for organizing steps, data, and/or laying out an ultimate action plan. Here are some examples of pictorial views of a project.
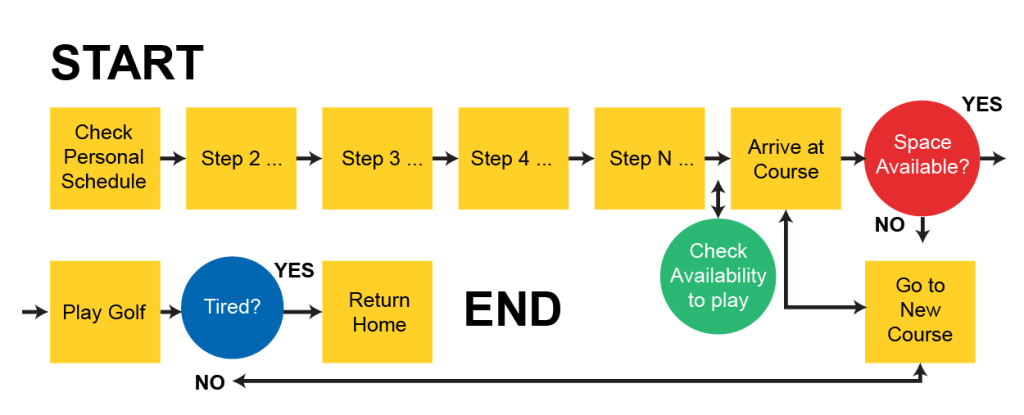
FLOWCHART
Issue: Define steps to go to play golf
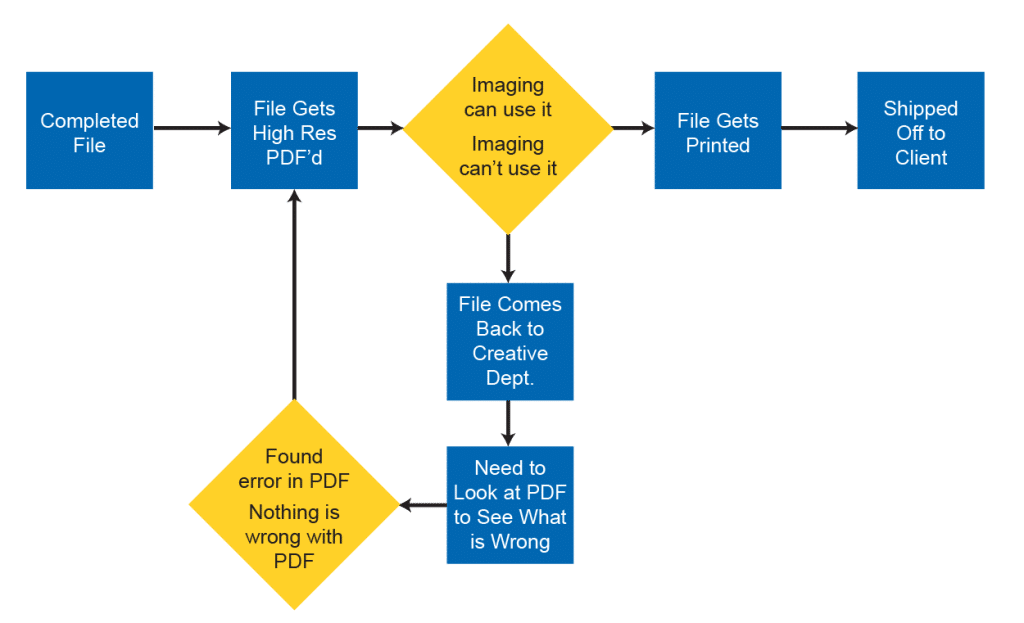
Issue: Transfer of files between Creative Department and Imaging Department
PARETO DIAGRAM
This one might be a little less intuitive. The Pareto Diagram is named after Wilfredo Pareto, an economist in the 19th century. Here’s how to create one.
- Identify an 80/20 pattern (20% of categories cause 80% of events)
- Create categories & define them
- Sort data into appropriate categories
- Depict data on a bar chart in descending order
- Identify the important few vs. the trivial many
- Select the category which is responsible for the majority of events being examined

Here’s a personal example from CMW from when we noticed a two-level 80/20 issue.
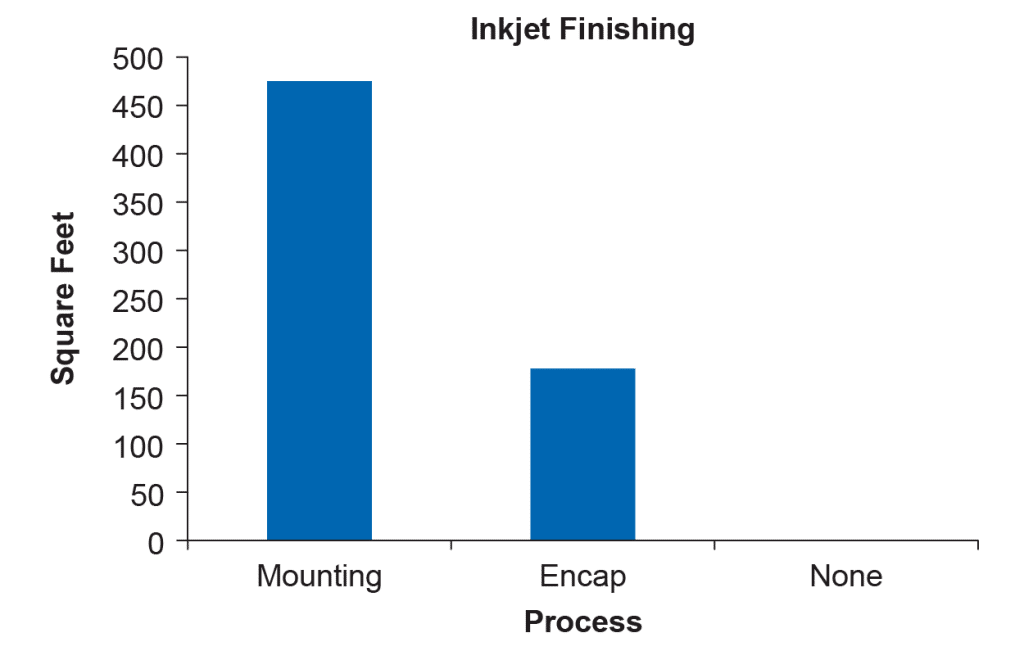
Issue 1: Of the 3 possible final processes for inkjet prints, mounting, encapsulating, and trim only (no finishing), Mounting (30%) accounts for approximately 70% of the work.
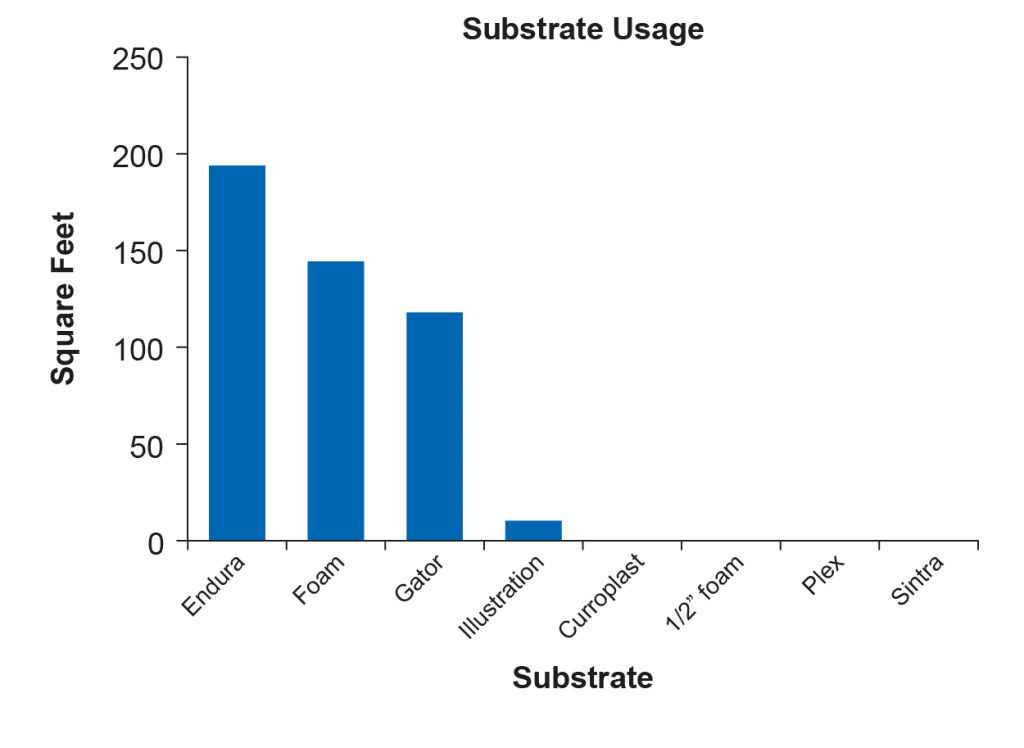
Issue 2: Within the mounting category, here are 9 possible substrates CMW stocks to mount to. In this case, enduraplast, foam & gator (33%) accounted for 97% of all mounting in the sample.
These are two great ways to map out an evaluation of an issue. However, there may also come a time when you’re faced with an issue that keeps coming up again and again and again. If you know how to handle it — that’s great. But for the long run, a key part of evaluating an issue like this must be examining the root cause, defined as
- The basic factors which contribute to a chronic problem. A high quality product/service design must address these factors, if it is to succeed.
- In a world of “firefighting”, seldom is time spent to determine and address “root cause.” This is a major reason why problems crop up again and again.
Luckily for you, in keeping with the theme, we’ve also identified a visual aid to help with finding root causes.
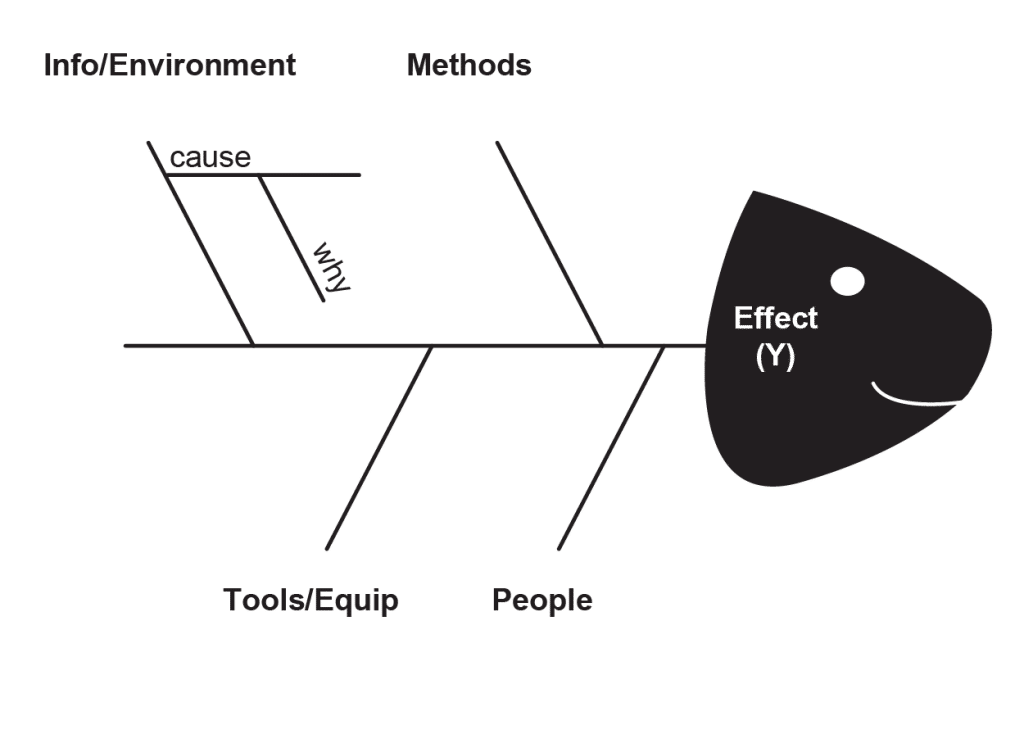
FISHBONE (ISHIKAWA) DIAGRAM
The Ishikawa Diagram, also known as the Fishbone Diagram, was the work of Japanese organizational theorist Kaoru Ishikawa. If you’ve never seen one before, here’s the gist.
- Write the Issue you want to address to the right of the fish’s “head”.
- Begin asking “why did this problem occur?”
- Take a sub-bone and ask “why?” (5 levels) or until you feel you have gotten below symptoms.
- Keep asking why by continuing to brainstorm sub-causes until all ideas are exhausted.
- Review completed Fishbone Diagram and determine major patterns of potential causes.
Don’t firefight if you don’t have to — fix the problem at the source.
—
A thorough assessment of your requirements and/or problems for a project — or just in any day at the office — as well as an accurate analysis of the appropriate data, will give you confidence and clarity moving forward. Invest the time to dissect an issue, whether that’s just mapping out a timeline, or digging for its root cause. You’ve listened well to your customer — now evaluate what you’ve been given.
Bonus Exercise: Make a Chart or Diagram
Use any of the example charts and diagrams from this post and apply them to your own projects. Trust us — they work!